Gantt charts are useful for displaying the duration of events or activities over time. In a Gantt Bar Chart, each separate mark (usually a bar) shows a duration. For example, you could use a Gantt chart to display average delivery time for a range of products. For more information about Gantt bar mark type, see Gantt Bar Mark.
The following exercise walks you through using Gantt charts to show how many days, on average, elapse between order date and ship date. The data is broken out by product category and ship mode. The view displays results on a weekly basis for a three-month period.
-
Connect to the Sample - Superstore - English (Extract) data source, which is included with Tableau Desktop.
-
Drag the Order Date dimension to Columns.
The date is automatically aggregated by year, and column headers are created with labels showing the years in your data.
-
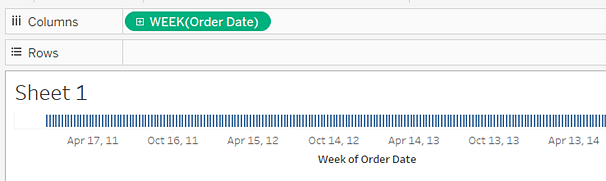
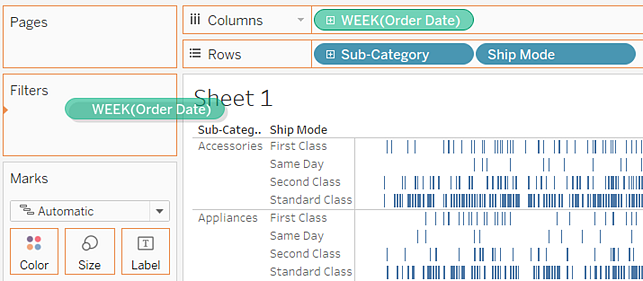
Right-click the Order Date field on the Columns shelf and choose Week Number:
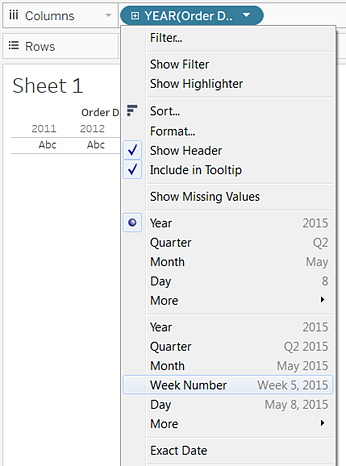
The column headers change—the individual weeks are indicated by tick marks because there are too many weeks in a four-year span (208) to show as labels in the view:
-
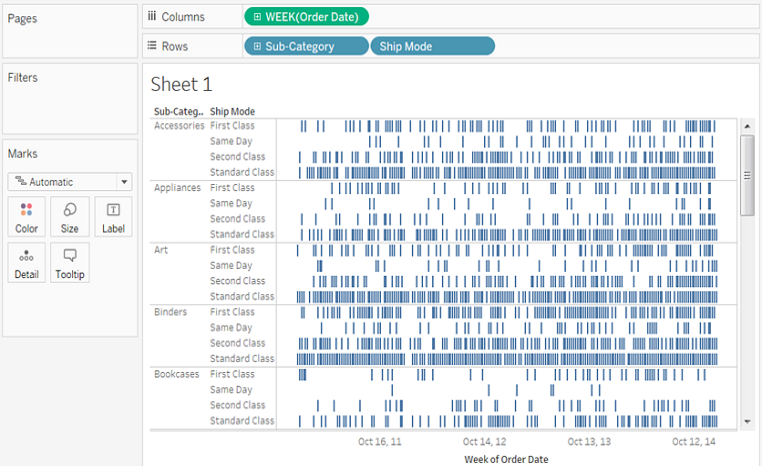
Drag Category and Ship Mode dimensions to the Rows shelf, dropping Ship Mode to the right of Category.
This builds a two-level nested hierarchy of dimensions along the left axis:
Now we want to size the marks according to the length of the interval between the order date and the ship date. But there are no measures that we can use to capture that interval. However, we can create such a measure by creating a calculated field.
-
Right-click anywhere in the Data window (on the far left) and choose Create Calculated Field:

This opens the Calculated Field dialog box. This option is also available from the Analysis menu.
-
Name your calculated field OrderUntilShip.
-
Clear any content that may be in the Formula box by default.
-
Type (or copy) the following formula and click OK:
DATEDIFF('day',[Order Date],[Ship Date] )
This creates a custom measure that captures the difference between the Order Date and Ship Date values, in days.
-
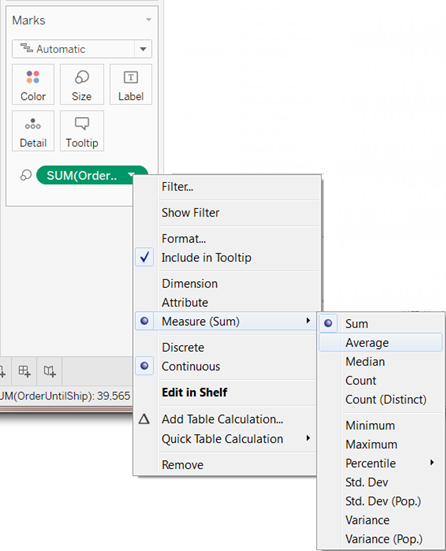
Drag the OrderUntilShip measure to Size on the Marks card.
The default aggregation for OrderUntilShip is Sum. But we're not interested in adding all the intervals—it makes more sense to average them.
-
Right-click the SUM(OrderUntilShip) field on the Marks card, choose Measure (Sum), and then choose Average:
The view is coming along. But there are too many marks squeezed into the view:

We can make our data more readable by filtering down to a smaller time window.
-
Hold down the Ctrl key and drag the Week(Order Date) field from the Columns shelf to the Filter shelf.
By holding down the Ctrl key, you tell Tableau that you want to copy the field to the new location, with whatever customizations you have added, without removing it from the old location.A Filter Field dialog box opens. Click Range of Dates and then click Next, to display this dialog box:

-
Set the range to a three-month time interval, such as 1/1/2012 to 3/31/2012, and the click OK.
It can be difficult to get the exact date using the sliders—it's easier just to type the numbers you want directly into the date boxes.
-
Drag the Ship Mode dimension to Color on the Marks card.
You now have a view that lets you see all sorts of information about the lag between order times and ship times:

Which ship modes are more prone to longer lag times? Do lag times vary by category? Are lag times consistent over time?
If you publish this view to Tableau Server,
you can include Quick Filters that let users interact with the view by
varying the time window, or filtering out various categories or ship
modes. For more information, see Publishing Workbooks.
This comment has been removed by the author.
ReplyDeleteIt’s really a nice and helpful piece of info. I’m happy that you simply shared this useful info with us. Please keep us up to date like this. Thanks for sharing.apple hilfe berlin
ReplyDelete