For both relational and multidimensional data sources, you can change the date level using the field’s context menu after dragging it to a shelf. For multidimensional dates, the levels available in the context menu are given by the levels defined in the date hierarchy. For relational dates, you can select between the discrete date levels at the top of the menu or the continuous date at the bottom. A preview of each date level is shown. Below is the field menu for a relational date with the discrete Year level selected.
In Tableau, multidimensional data sources are supported only in Windows.

For relational dates, there are many different date levels available, as you can see above. When you select a particular level, Tableau asks the data source to perform a computation on the date field. For example, suppose a particular row in your data source has a date entry of 01/23/07. The year is 2007, the quarter is 1 because January falls in the first quarter, and the week number is 4 because January 23rd falls in the fourth week. How the date level is computed depends on the configured Date Properties for the data source. See Date Properties for a Data Source.
Some date levels might not make sense for your relational
data source. For example, if the date format does not include time
information such as hour, minute, or second, then selecting one
of these options will not add any data to your view.
You can work with dates at varying levels of detail simultaneously.
You do this by drilling into dates by clicking the  control. You can also drag
date fields to the Rows or Columns shelf
multiple times in order to nest them and to drill down into them
at varying levels of detail.
control. You can also drag
date fields to the Rows or Columns shelf
multiple times in order to nest them and to drill down into them
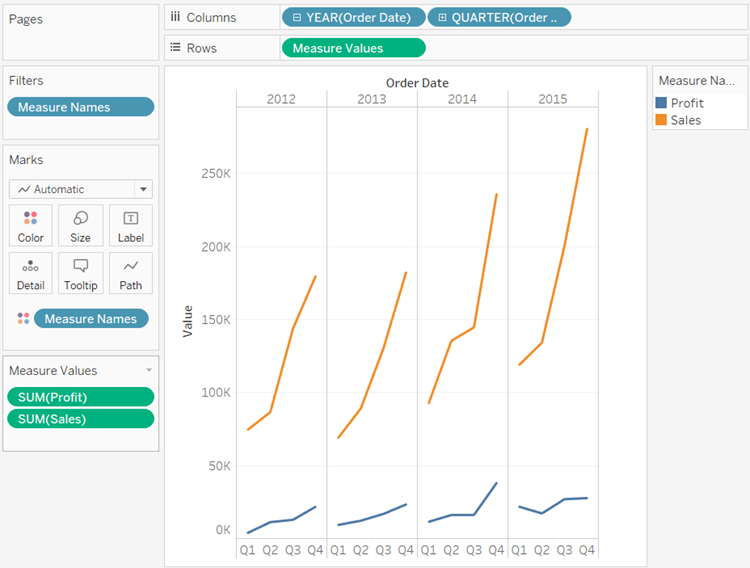
at varying levels of detail.For example, the view shown below drills down into the year level to display the quarter level as well.
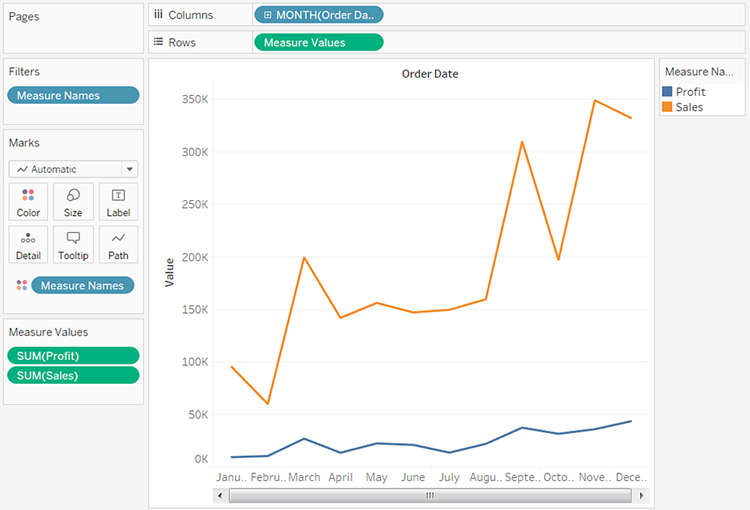
By removing one of the date fields from the Columns shelf, and then selecting Month from the remaining date field’s context menu, you can display the data for each month across all years.
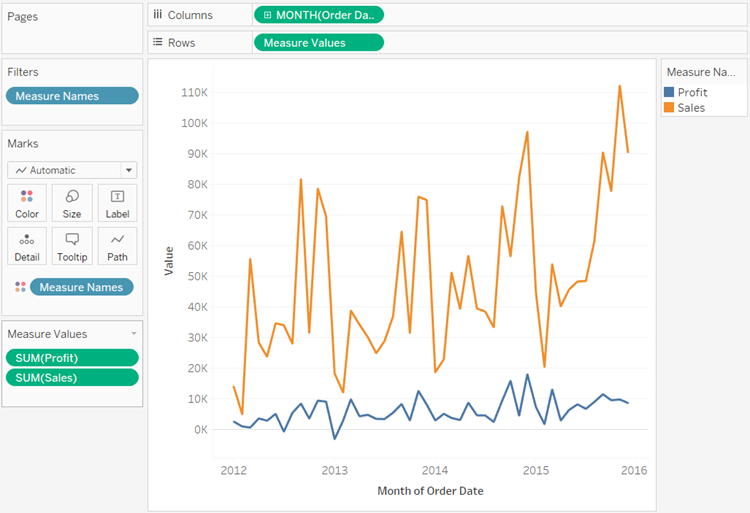
To display even finer granularity, select Month from the lower, continuous section of the field's context menu.

Tableau then displays the dates across the range of available years, at a month-by-month level of granularity.
Hi, I read your whole blog. This is very nice. Good to know about the Tableau and is very demanding in future. We are also providing various Tableau Training Certification , anyone interested can Tableau certification for making their career in this field.
ReplyDelete