You can create a group by selecting headers in the view, selecting marks, or based on a dimension in the Data window. Regardless of how you create the group, a new group field is added to the Data window. You can use the group field like any other field in the view including on the Columns and Rows shelves, on the Marks card, and the Filter shelf. When you create a group by selecting headers or marks in the view, the view is updated to use the grouped field.
Correct Data Errors or Combine Dimension Members
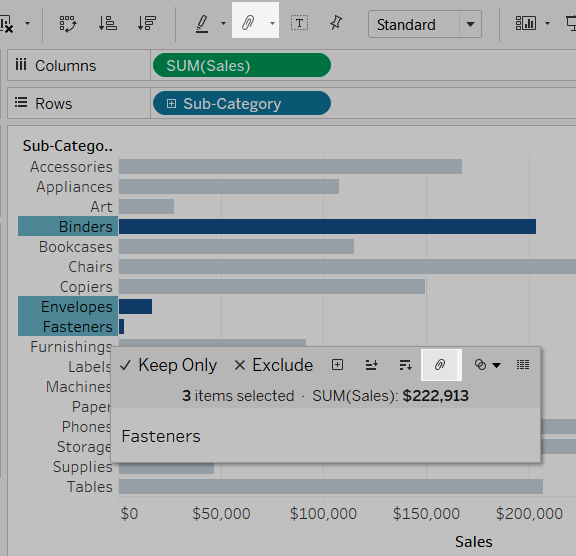
If you are using groups to correct data errors (combine CA and California) or to combine dimensions members (combine East and West regions), the easiest way to create the group is by selecting headers in the view.-
Hold the CTRL or Shift key on the keyboard to multi-select headers in the view.
-
Click the Group button
 on the toolbar.
Alternatively, you can right-click and select Group or click the Group icon on the tooltip.

The grouped field is also added to the Data
window. You can use it just like any other field in the
view. For example, you can drag it to the shelves, the Marks card, and
add it to relational hierarchies. Group fields cannot be used in
calculated
fields.
Color a View Using Groups
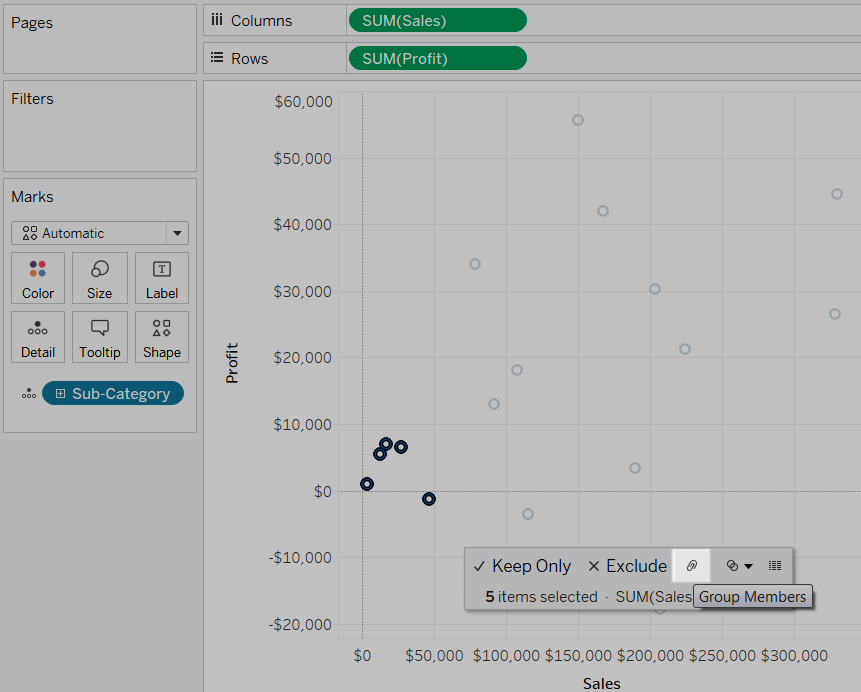
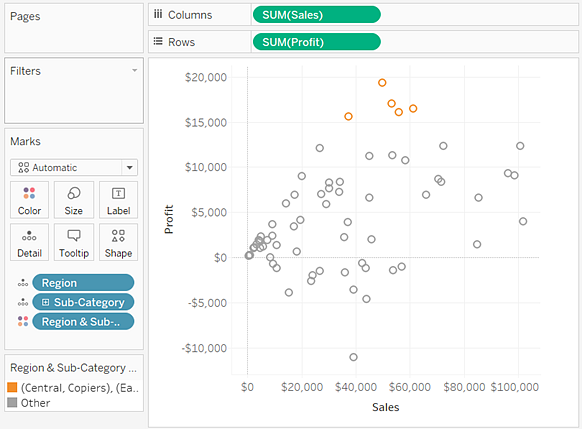
In addition to correcting data errors and combining dimensions, you can visually identify groups of related marks by selecting marks directly. This technique is especially useful when working with a scatter plot or a view that doesn't have headers that you can select when defining the group.-
Hold the CTRL or Shift key on the keyboard to select one or more marks in the view.
-
Click the Group button on the toolbar.
Alternatively, you can right-click and select Group or click the Group icon on the tooltip.
The selected marks are grouped and all other members are combined into an "Other" category. The new group field is added to Color. See Including an Other Group to learn more about grouping fields using Other.
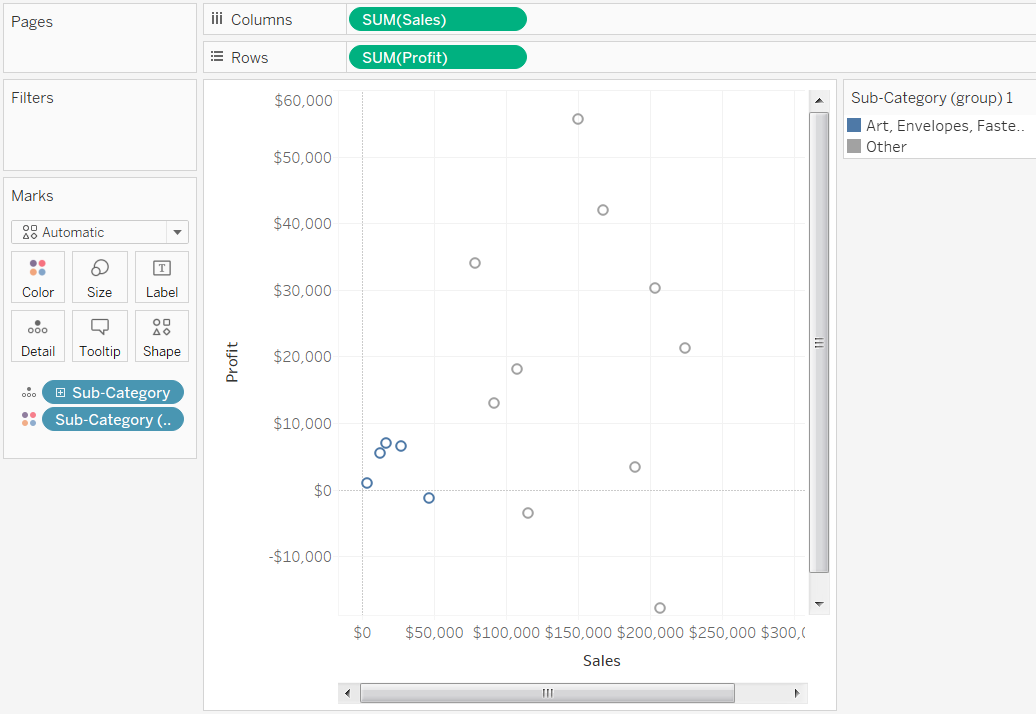
If there were already fields on Color, they are moved to Detail and replaced with the group field.
When
you create groups by selecting marks, it's possible that the marks will
represent multiple dimensions. For example, you may have a scatter plot
that shows the Sales vs. Profit by Region and Category. In this case, a
selection of marks will represent members of both the Region and
Category dimensions. When the selection represents multiple dimensions,
the Group menu lets you choose to group on All Dimensions or a
particular dimension.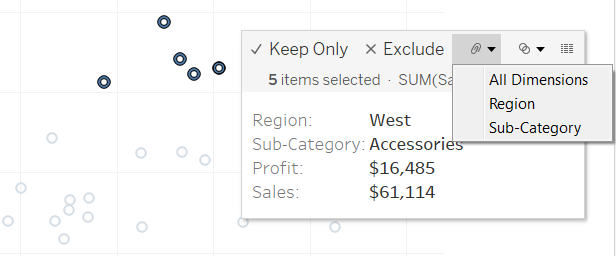
In the example above, the five selected marks represent a region and the following category combinations .
- Storage & Organization, International
- Bookcases, International
- Computer Peripherals, International
- Office Furnishings, International
- Appliances, International
| All Dimensions | Category | Region |
|---|---|---|
 | 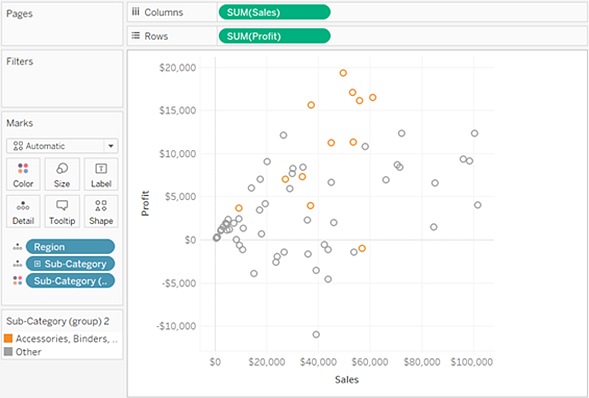 |  |
| The five marks are combined and the rest of the marks are added to an "Other" category. | All marks associated with any of the five categories are combined and everything else is added to an "Other" category. | All marks associated with the five regions (in this case just International) are combined and everything else is added to an "Other" category. |
Create Groups in the Data Window
Whenever you create a group, a group field is added to the Data window. When you create a group by selecting headers or marks in the view, the new group field is also added to the view either on the Rows or Columns shelf or to Color. Instead of creating a group by selections in the view, you can create a group directly from the Data window.- Right-click a dimension in the Data window and select Create
Group.
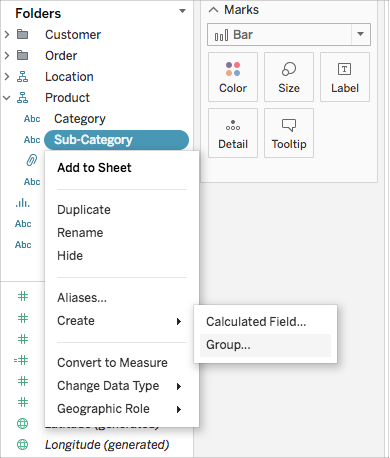
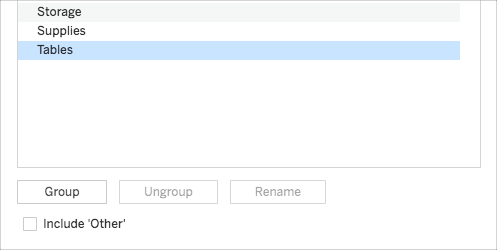
- In the Create Group dialog box, select several members that you want to group. Hold the CTRL key on your keyboard to select multiple members.

- Click the Group button at the bottom
of the dialog box.

To add to or remove members from a group, right-click
the grouped field in the Data window and select Edit Group.
In the Edit Group dialog box you can also change the default name
of the group and combine fields into new groups. Refer to Editing an Existing Group to learn more. Alternatively, you can ungroup members by selecting them in the view and clicking the Ungroup button  on the toolbar or tooltip.
on the toolbar or tooltip.
Thanks for sharing valuable information Tableau online training
ReplyDeleteThank you for sharing wonderful information with us to get some idea about it.
ReplyDeletetableau certification training